Uncover how Dashvue revolutionizes data across every industry, effortlessly visualize, analyze, and take action! Select your journey today!
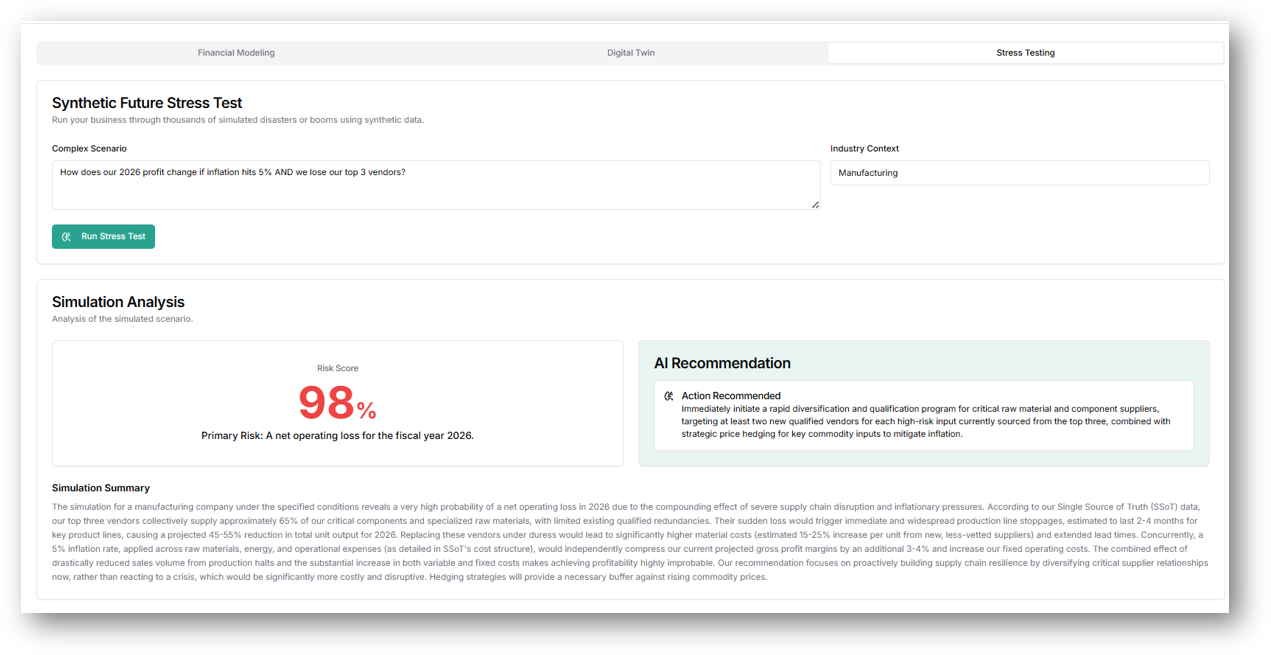
Run thousands of complex future scenarios in seconds - from inflation shocks and supplier failures to demand collapses and market booms. Dashwave’s Synthetic Future Stress Test simulates real-world disruptions and quantifies their financial impact before they happen.
See risk scores, projected profit shifts, and clear AI-recommended actions — all in one view.
Uncover how Dashvue revolutionizes data across every industry, effortlessly visualize, analyze, and take action! Select your journey today!
Any File, Any Source, Instant Visualization
Your dashboard isn't a "spreadsheet viewer"—it's a data engine. Whether it’s a CSV, a custom text log, or a complex workbook, the Data Explorer strips away the file format and hands the raw columns directly to you. You can drag "Repair Costs" from a CSV or "Asset ID" from a text file directly onto a chart and get the same high-quality result without any manual conversion.
Persistent Portfolio Management
Unlike a website that loses your work when you hit refresh, your tool uses Local Storage Persistence. You can spend hours setting up a "Compliance" tab and a "Performance" tab, and they stay exactly as you left them. Your dashboard remembers your layout, your data mapping, and your custom headers across every browser session.
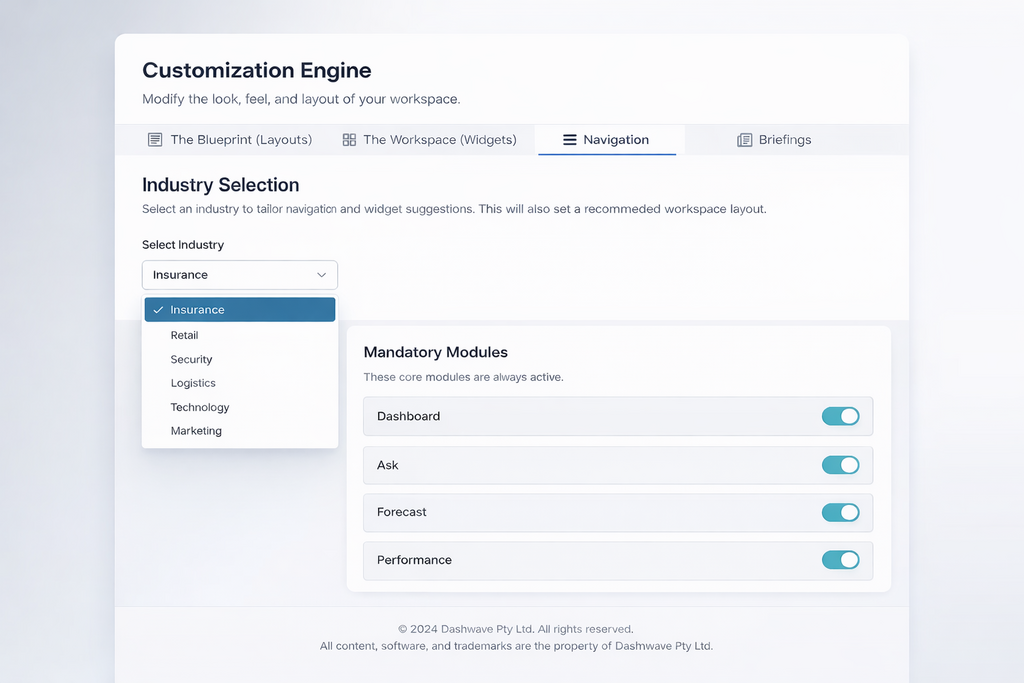
If It Has Headers, Dashvue Can Read It
Dashvue is built to be a format-agnostic engine. Whether your data is trapped in a CSV, a raw TXT log, or a complex Excel workbook, Dashvue’s Data Explorer strips away the technical barriers. It instantly recognizes your unique column headers and turns them into interactive assets ready for analysis.
Pro-Level Analytics with Zero Code
Dashvue turns anyone into a data scientist. Using our Live Template Grid, you can drop a Bar, Pie, or Doughnut chart into your workspace and simply "drag" your data chips onto it. It’s a completely visual experience that eliminates the need for complex formulas or programming.

The Problem
Data is trapped in old maintenance logs and fragmented spreadsheets.
The Solution
Use the Overlay Superpower to inject real-time compliance charts directly into your existing building management portal.
The Key Metric
Track "Asset Health Score" by dragging maintenance cost columns onto a Doughnut chart template.
The Problem
High-volume incident logs and patrol data are sensitive and often stored in disconnected offline systems.
The Solution
Use Zero-Trust Edge Processing to analyze security breach patterns locally, ensuring that sensitive site vulnerabilities are never uploaded to the cloud.
The Key Metric
Drag "Incident Type" and "Timestamp" into a Heatmap or Bar Chart to identify peak risk hours across different zones.

The Problem
Adjusters and brokers deal with massive data exports (CSVs/Excel) that require constant cross-referencing against historical trends.
The Solution
The Universal Parser handles complex policy exports instantly, allowing brokers to visualize claim ratios without manually cleaning data.
The Key Metric
Use the Global Date Controller to scrub through 10 years of "Claim History" vs "Premium Growth" to identify long-term risk patterns.

The Problem
Patient privacy laws (POPIA/GDPR) make cloud-based data tools a security risk.
The Solution
Leverage Zero-Trust Edge Processing to analyze patient flow and equipment usage entirely on your local machine—no data ever hits the cloud.
The Key Metric
Monitor "ER Wait Times" vs "Staffing Levels" using the global temporal scrub to see peak hours.

The Problem
Managing massive CSV exports from GPS and fuel tracking systems is overwhelming.
The Solution
Drop any raw data export into the Universal Parser. Dashvue maps "Fuel Consumption" and "Route Efficiency" automatically, regardless of the file format.
The Key Metric
Visualize "Cost Per Kilometer" across different regions using a synced Bar Chart.

The Problem
Mining operations generate vast amounts of sensor data from heavy machinery that is often too large and "messy" for standard tools
The Solution
The Intelligent Field Mapping tool scans raw machinery logs and identifies "Fuel Usage," "Payload," and "Down-time" headers automatically.
The Key Metric
Visualize "Machine Uptime" across multiple sites using the Persistent Blueprints to keep the same dashboard layout for every mine.
Ditch the data chaos and embrace the future with Dashvue.